LanguageLearning Subreddit Survey Exploratory Analysis
Welcome to this analysis of the /r/languagelearning subreddit survey data. Before I begin I should mention a bit about myself. In addition to my role as the moderator of the /r/languagelearning subreddit on reddit, I am also the author of the ebook How to Teach Yourself a Foreign Language, which is available for free on my website. I am also a data analyst in my real life.
The survey was taken on September/October 2019 by the users of the /r/LanguageLearning subreddit. The Google forms analysis is available here
In addition to sharing the results of the survey, this post is intended to help give people an idea of how data is analysed using Python.
Some of the dataframes do not render in this blog due to its use of Markdown language. If you would like to view those, you can go to the project on GitHub.
Getting Started
import numpy as np
import pandas as pd
import seaborn as sns
import matplotlib.pyplot as plt
%matplotlib inline
sns.set(color_codes=True)
First we need to view our data to get a quick idea of what is in it.
df = pd.read_csv(".spyder-py3\surveyfull2.csv")
df.head()
[Dataframe not visible in blog]
Let’s look at the data dimensionality.
df.shape
(844, 34)
And get some more info:
df.info()
<class 'pandas.core.frame.DataFrame'>
RangeIndex: 844 entries, 0 to 843
Data columns (total 34 columns):
Age                            815 non-null float64
selftaught_to_nonselftaught    838 non-null float64
native_langs                   840 non-null float64
fluent_nonnative_langs         806 non-null float64
langs_actively_learning        811 non-null float64
beginner_nonnative_langs       811 non-null float64
total_langs                    802 non-null float64
rank_natural_talent            842 non-null float64
rank_motivation                843 non-null float64
rank_environment               842 non-null float64
rank_selfconfidence            842 non-null float64
rank_grammar                   842 non-null float64
rank_speaking_early            841 non-null float64
rank_have_teacher              842 non-null float64
rank_listenread                842 non-null float64
rank_drill_vocab               841 non-null float64
rank_pronunciation             843 non-null float64
self_successful                839 non-null float64
self_talented                  837 non-null float64
self_enjoy                     840 non-null float64
self_motivated                 838 non-null float64
self_noncommitted              839 non-null float64
self_confident_speaker         836 non-null float64
self_easy                      838 non-null float64
self_important_fluent          839 non-null float64
self_nervous                   835 non-null float64
mins_per_day                   808 non-null float64
level_education                832 non-null object
level_education.1              0 non-null float64
gender                         842 non-null object
country_living                 828 non-null object
country_from                   815 non-null object
specific_goal                  837 non-null object
studied_in_uni                 831 non-null object
dtypes: float64(28), object(6)
memory usage: 224.3+ KB
Overview
Now we need to get an overview of the data.
df.describe(include='all')
[Dataframe not visible in blog]
Already there’s a lot of information if you know what the columns mean. The “rank_” questions asked people how they ranked the importance of certain aspects for learning from 1 to 7. 1 being not at all important and 7 being very important. You can see, for example, that people on average ranked motivation (mean = 6.6) far more highly than natural talent (mean = 3.4).
“self_” questions ask people to rank their themselves from 1 to 7 on any trait. For example, “self_important_fluent” asks people how important reaching fluency is to them.
We can also see some oddities. You might have noticed there is a blank column. In addition, somebody stated they studied for 72,000 minutes per day—that’s 1,200 hours day. Stated differently, this person claims to study 50 days, every day! Now that’s efficiency!
Cleaning
Before we do further analysis let’s do some quick cleaning.
df = df.drop(["level_education.1"], axis=1) # duplciate column
df = df[df.mins_per_day < 14*60] # Study over 14 hours per day ignored
df.describe()
[Dataframe not visible in blog]
Analysis
Now having removed the most egregious survey entries. Let’s take a closer look at some of the stats to learn a bit about the people who took the survey.
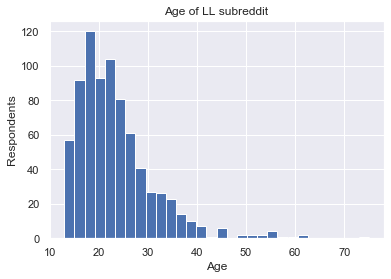
fig, ax = plt.subplots()
ax.hist(df['Age'],bins=30)
ax.set_title('Age of LL subreddit')
ax.set_xlabel('Age')
ax.set_ylabel('Respondents')
Text(0, 0.5, 'Respondents')
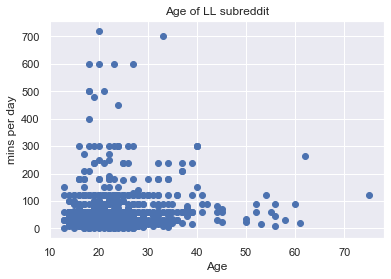
fig, ax = plt.subplots()

ax.scatter(df['Age'],df['mins_per_day'])
ax.set_title('Age of LL subreddit')
ax.set_xlabel('Age')
ax.set_ylabel('mins per day')
Text(0, 0.5, 'mins per day')
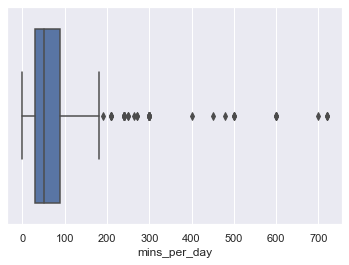
sns.boxplot(x=df['mins_per_day'])
<matplotlib.axes._subplots.AxesSubplot at 0x2eb0f7c0ac8>
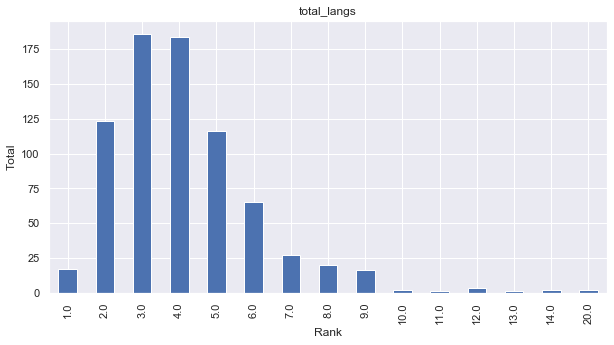
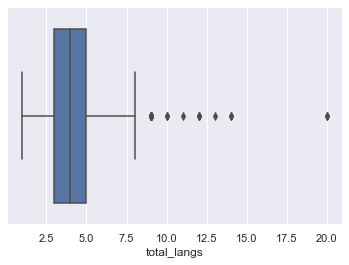
We can also view the number of languages our survey respondents claim to know.
col = 6
df_rank1 = df.iloc[:,col].value_counts().sort_index()
print(df_rank1)
dr_rank_title = df.columns[col]
df_rank1.plot(kind='bar', figsize=(10,5))
plt.title(f'{dr_rank_title}')
plt.ylabel('Total')
plt.xlabel('Rank')
plt.show()
1.0      17
2.0     123
3.0     186
4.0     184
5.0     116
6.0      65
7.0      27
8.0      20
9.0      16
10.0      2
11.0      1
12.0      3
13.0      1
14.0      2
20.0      2
Name: total_langs, dtype: int64
sns.boxplot(x=df['total_langs'])
<matplotlib.axes._subplots.AxesSubplot at 0x2eb0f7ce710>
That should do for a rough overview of what our data looks like. To finish, I thought it would be interesting to show you a correlation heatmap of the data.
plt.figure(figsize=(30,15))
heatmp = df.corr()
sns.heatmap(heatmp,cmap="BrBG",annot=True)
heatmp
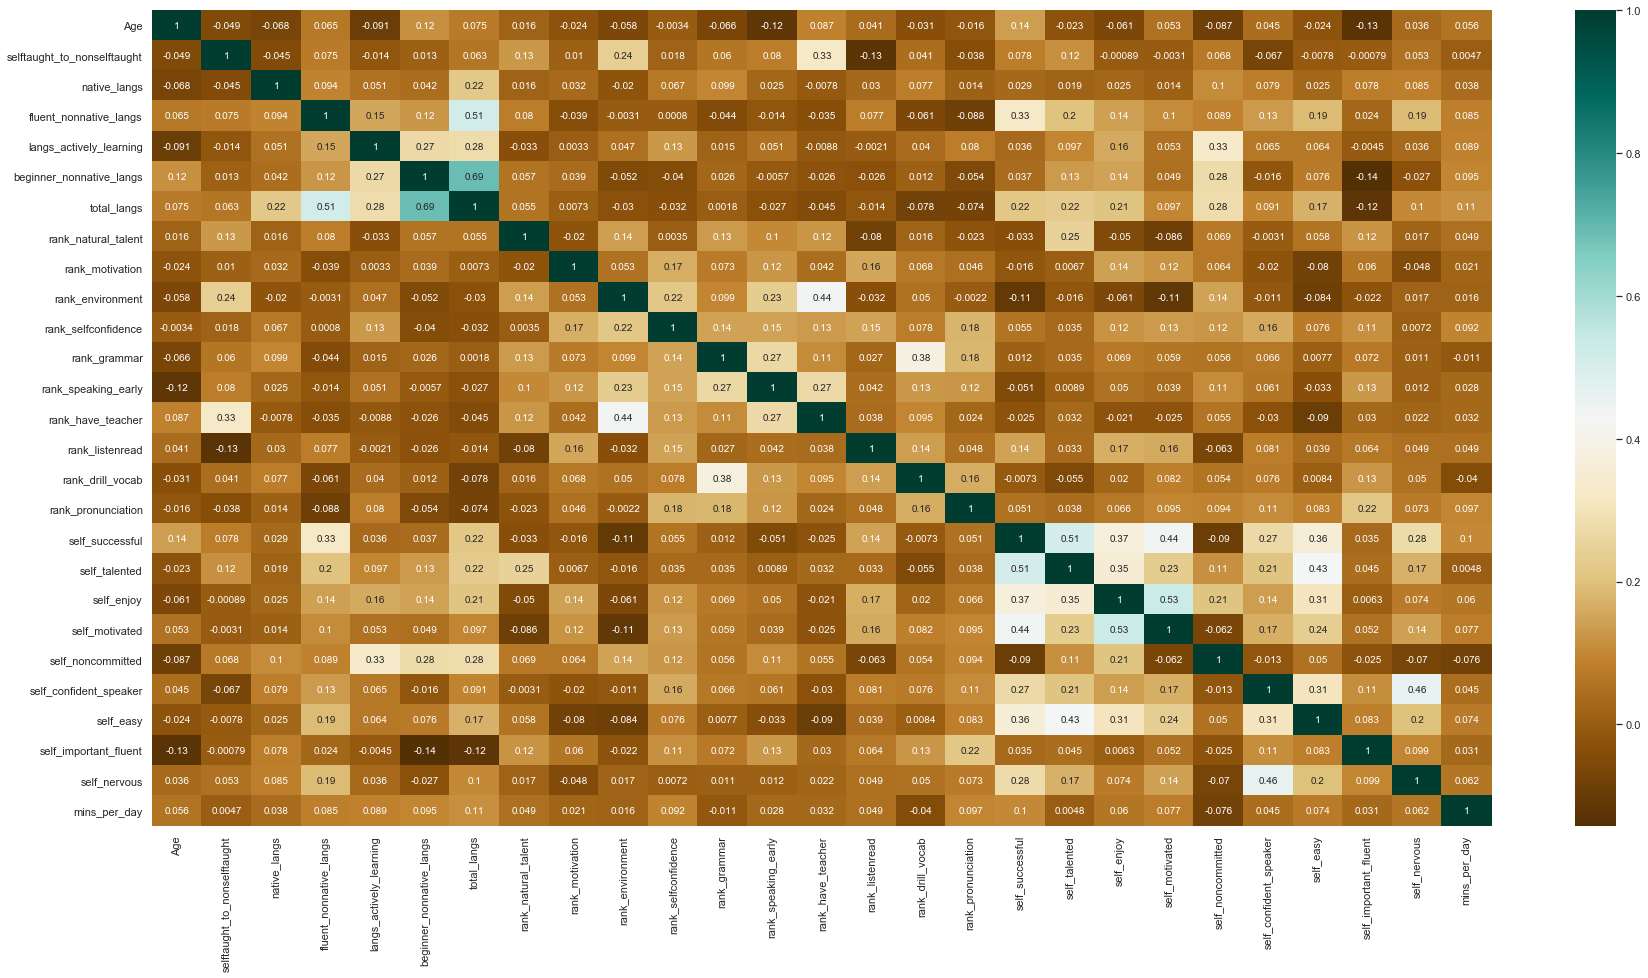
Some interesting correlations stand out. For example:
- People who rank themselves as talented are more likely to say that talent is an important factor in determining success.
- People who felt that studying grammar was important also tended to recommend drilling vocabulary.
- People who rank the environment as being important also tended to rank having a teacher as important also.
- There is a strong correlation between a variety of self-rankings around high success, talent, motivation, and enjoyment. This grouping was also more likely to report finding language learning easy.
- People who said they struggled with committing to a single language also tended to speak more languages at a beginner level, but this did not extend to a strong correlation with fluent-level languages. They also reported learning more languages at the same time. Surprise, surprise!
- It is hard to find any correlation between the number of fluent non-native languages and the types of strategies people tend to recommend. It seems like anything can work.
- Younger people tended to rank reaching fluency as less important. This is not a very strong correlation, however.
Thanks for reading!